40% Off Coupon on OfficeReports Analytics Pro – A Complete Cross-Tab Tool on Excel – For Windows
Add and analyze data and create tables, charts and full reports in Excel and PowerPoint and Word. Get OfficeReports Analytics Pro License now with 40% Off Coupon & Save up to 60% on Annual subscription.
40% Off Coupon | 24×7 Customer Support
OfficeReports Analytics Pro Review Video
Add raw data from survey software directly to Excel and use the OfficeReports features to analyze the data and create all types of cross-tabs including statistical tests and weighting of data.
OfficeReports Analytics Pro Review at a Glance
Tabulation software or cross-tab tools includes a lot of specialized features for analyzing and reporting survey data. This includes a variety of different tables and features which are constantly used when reporting survey data. For example weighting of data, including statistical tests info in tables and much more. There are many good tabulation softwares available in the market, but OfficeReports is the only tool that works as a plug-in for Excel and PowerPoint. This simplifies the process from raw data to final reports and makes OfficeReports Analytics Pro the obvious choose if you need to report in Microsoft Office.
OfficeReports Analytics Pro is a complete cross-tab tool added to Excel. Now you can produce cross-tabs including all relevant statistical tests all from within Excel. OfficeReports Analytics Pro can import data from i.a. Excel and SPSS or it can connect to your SurveyMonkey and SurveyGizmo surveys.
Interactive cross-tabs in Excel
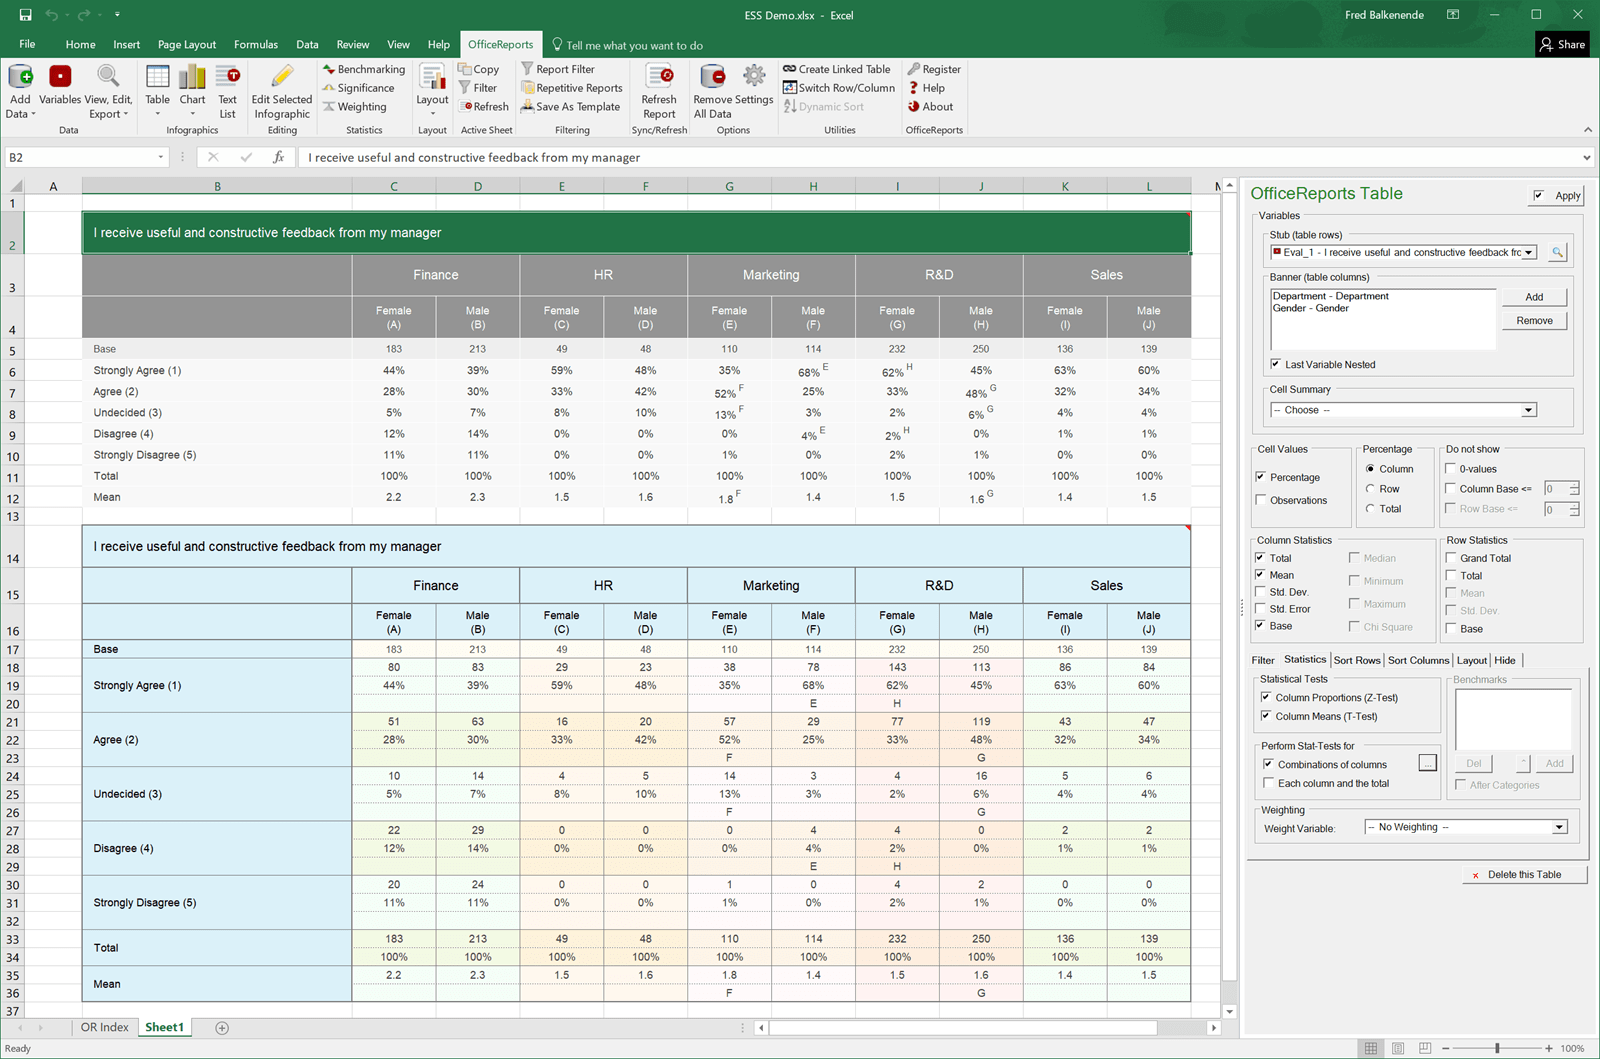
OfficeReports Analytics Pro let’s you create interactive banner tables (cross-tabs). Advanced Statistics like T-Test, Z-test and Pearson correlation are available. The ‘Analytics Pane’ becomes visible as soon as you add a table, or when you click in a cell of an existing table. In the pane, all the features are available so you can change the table any time you want. Click on the picture on the right to see a screenshot showing the same table in 2 different layouts.
Productivity
OfficeReports Analytics Pro let’s you create a single table at the time, or generate many tables at once. All tables are interactive and can be changed and updated at any time. You can copy a sheet and define a new filter for all tables on the copied sheet. You can also start creating the tables even before all data is collected. Just import the missing data later, click the Refresh button and the whole report is updated with the new data.
Pivot Table/Chart
Using the settings pane, tables and charts created using OfficeReports are just like pivot tables. You can keep on changing variables, filters and settings. You cannot do the following in Excel’s PivotTable, but with OfficeReports you can!
Analytics Report
OfficeReports Analytics Pro creates a complete standard ‘Analytics Report’ in seconds. The report contains as many crosstabs (banner tables) as you wish. T-tests and Z-tests are automatically performed. The reports can be generated in the layout you wish, ready to send to your customer.
Reporting is all about analyzing your data and visualizing the results. Mostly, these results are displayed in PowerPoint. A very common way of working is to export crosstabs (banner tables) to Excel, and copy and paste the results from here into PowerPoint.
Features
Key Features of OfficeReports Analytics Pro:
- Free Support
- Documentation, Videos
- Free Email Support
- Import
- Import data from Excel, SPSS and Triple-S
- Connector to SurveyMonkey and SurveyGizmo
- Import multiple datasets
- Merge datasets
- Unlimited Maximum number of cases
- Unlimited Maximum number of variables
- Variables
- Category, Numeric, Date and Text Variables
- Search & replace text
- Create Group Variables (multiple variables)
- Merge Variables
- Recode Variables: From Numeric Variables to Intervals
- Recode Variables: From Date Variables to Periods
- Recode Variables: Advanced Formula Editor
- Convert Text Variables to Category Variables
- Convert Category Variables to Text Variables
- Aggregate Variables
- Data View
- View data in a grid (like Excel)
- Edit data
- Filter or sort data
- Export raw data to Excel and SPSS
- Interactive Tables
- Unlimited number of Banner points
- Contents are numeric summary of Numerical Variable
- Nested tables – 2 level banner tables
- Observations, Percentages
- Percentages calculated per Row, Column or Total
- Grid tables containing Observations, Percentages or Mean Values
- Base, Total, Mean and Std. deviation
- Median, Minimum, Maximum
- Sort Rows and Columns
- Sort Like (another table or range)
- Mark categories that should not be sorted
- Filtering
- Significance tests
- Top/Bottom Box (NET)
- Top/Bottom N reporting
- Weighting
- Benchmarking
- Low Base notification: 2 levels by optional characters
- Ignore Report Filter
- Use OfficeReports Standard Layouts
- Localize texts for Total, Base, Mean, Median etc.
- Customize Table Layouts
- Interactive Charts
- Unlimited number of Banner points
- Contents are numeric summary of Numerical Variable
- Nested charts – 2 level banner charts
- Observations, Percentages
- Base, Total, Mean and Std. deviation
- Gridcharts with Observations, Percentages or Mean
- Sort Rows and Columns
- Sort Like (another OfficeReports Table or Excel Range)
- Mark categories that should not be sorted
- Filtering
- Significance tests
- Hide Rows and Columns based on the base
- Top/Bottom N reporting
- Weighting
- Benchmarking
- Low base notation: 2 levels by optional characters
- Ignore Report Filter
- Advanced Statistics
- Weight tables/charts using weights calculated by OfficeReports or an imported numeric variable
- Create frequency tables with confidence interval
- Chi Square
- Z-Test (Column Proportions)
- Student’s T-Test (Column Means)
- Welch’s T-Test (Column Means)
- T-Test/Z-Test using unweighted base or effective base
- Define which columns should be tested
- Testing columns pairwise: Show significance as font- or background-color
- Correlation
- Define Benchmarks
- Calculate respondent weights. OfficeReports uses RIM weighting, and can weight over many dimensions
- Productivity
- Insert many tables and charts in one step
- Copy and Paste table/chart and edit it
- Copy worksheet incl tables and charts
- Analytics Report
- Generate many reports using different filters
- Define Report filter
- Define Worksheet filters
- Save report as a template
- Collaborate
- Just email the files to colleagues
- Use Macros
- MS Office VBA-Macro Integration
Requirements
To run OfficeReports Analytics Pro with optimum reliability and performance, your system should match the following requirements:
System Requirements for Windows OS:
- OfficeReports works on Microsoft Windows with Microsoft Office 2016, 2013, 2010 – as well as Office 365 Business and Office 365 Business Premium.
System Requirements for Mac OS:
- Mac users: OfficeReports Analytics Pro does not support Microsoft Office for Mac. Folks here run Windows via Apple Bootcamp: http://www.apple.com/ca/support/bootcamp/
Download
Not sure if OfficeReports Analytics Pro does what you need? Try it out now. Please feel free to download OfficeReports Analytics Pro here. OfficeReports Analytics Pro by Office Reports ApS has been tested professionally and we are assured that no viruses, Trojans, adware or malware contained.
Windows
Try OfficeReports for 14 days
Buy Now
OfficeReports Analytics Pro retails for $179.00/month, But, on our website, THE Software Shop, you can save up to 60% on your purchase of its license key with our discount coupon code. This offer is available for a limited time!
Desktop License
Desktop License/Monthly Subscription
- Free Technical Support
- Free Updates/Upgrades
- Can be used on a single workstation
*The discount coupon & your local VAT (Value added tax - if available, vary by country) will be applied at checkout automatically including your local currency will be converted.

Desktop License/Annual Subscription
- Only $69.95/month
- Free Technical Support
- Free Updates/Upgrades
- Can be used on a single workstation
*The discount coupon & your local VAT (Value added tax - if available, vary by country) will be applied at checkout automatically including your local currency will be converted.
DESKTOP LICENSE allows users to install and run OfficeReports on a single workstation. This license is tied to the workstation’s hardware and cannot shared with other users, and can only be moved to another machine after contacting us. This license is most suitable for mobile computers or single user/workstation setup.
Here are some of the benefits and limitation of standalone licenses:
- Pros:
- Suitable when you need the software on a single workstation
- Less expensive than a comparable network license
- Cons:
- When hard drive fails, an admin fee must be paid to request a replacement license
- Less cost effective when many users need to access the software
- License can only be moved after contacting OfficeReports Team
Floating License

Floating License/Monthly Subscription
- Free Technical Support
- Free Updates/Upgrades
- Can be installed on any number of workstations.
*The discount coupon & your local VAT (Value added tax - if available, vary by country) will be applied at checkout automatically including your local currency will be converted.

Floating License/Annual Subscription
- Only $174.95/month
- Free Technical Support
- Free Updates/Upgrades
- Can be installed on any number of workstations.
*The discount coupon & your local VAT (Value added tax - if available, vary by country) will be applied at checkout automatically including your local currency will be converted.
FLOATING LICENSE: Software can be installed on any number of workstations. The OfficeReports license server keeps track of how many licenses are in use at one time. When an application using network licensing starts, it first checks to see if a network license is available to use. If so, a license is then checked out from the pool of licenses. When a user exits the application, or the license is idle for a period of time, the license gets checked back into the pool making it available to other users.
Here are some of the benefits and limitations of network licenses:
- Pros
- Licenses are available to all workstations maximizing software asset utilization
- License idle time is minimized by sharing
- Cost effective: less licenses are required when a company has many users
- Cons
- Not suitable for single user installations
- More expensive than standalone licenses
WPS Office 2016 Business Edition (Professional Edition) BEST SELLER
WPS Office Premium: Yearly Subscription BEST OFFER
iolo System Mechanic Business BEST SELLER
Zoolz Business Cloud Backup EXCLUSIVE
Omniconvert Explore BEST SELLER
OfficeReports Analytics Pro Giveaway is un/available at this moment.
Please note that once you signed in, do not close this page. You will be shown how to get this offer for free.
Also, check out the latest software giveaways that are available here on the software giveaway page.
OfficeReports offers both types of software licenses: floating licenses which are also referred to as concurrent licenses, and desktop licenses, also known as workstation or standalone licenses.
Thanks for reading OfficeReports Analytics Pro Review & Enjoy the discount coupon. Please Report if OfficeReports Analytics Pro Discount Coupon/Deal/Giveaway has a problem such as expired, broken link, sold out, etc while the deal still exists.


